
21. Reports
What each of the ten reports shows, its filters, and exporting to PDF or Excel.
The Reports page
Reports in the sidebar opens a page of cards, one for each report you are allowed to view. Each card shows a category, the report's name, a one-line description and a View link.
| Category | Report | The question it answers |
|---|---|---|
| Financial Statement | Income & Expenditure Statement | Did the society earn more than it spent in this period? |
| Financial Statement | Balance Sheet | What does the society own and owe on a given date? |
| Receivables & Dues | Defaulter List | Which bills are past their due date and still unpaid? |
| Receivables & Dues | Collection Efficiency | How much was collected compared with what was billed? |
| Tax & Compliance | Tax Report | How much GST was charged, at each rate? |
| Unit Accounting | Flat-wise Ledger | What has one flat been billed, what has it paid, and what does it owe? |
| Expenses & Payables | Expense Register | What vendor and petty cash expenses were entered in this period? |
| Expenses & Payables | Vendor Dues | For each vendor, how much is waiting for approval and how much is posted? |
| Registers & Audit | Waiver Register | Which waivers were requested, and who decided them? |
| Registers & Audit | Penalty Register | Which bills carry a late-payment penalty, and how much? |
The count at the top, for example 10 Available Reports, is the number of cards you can see. A user with no report permissions sees No Reports Available.
Open Reports arrow_forward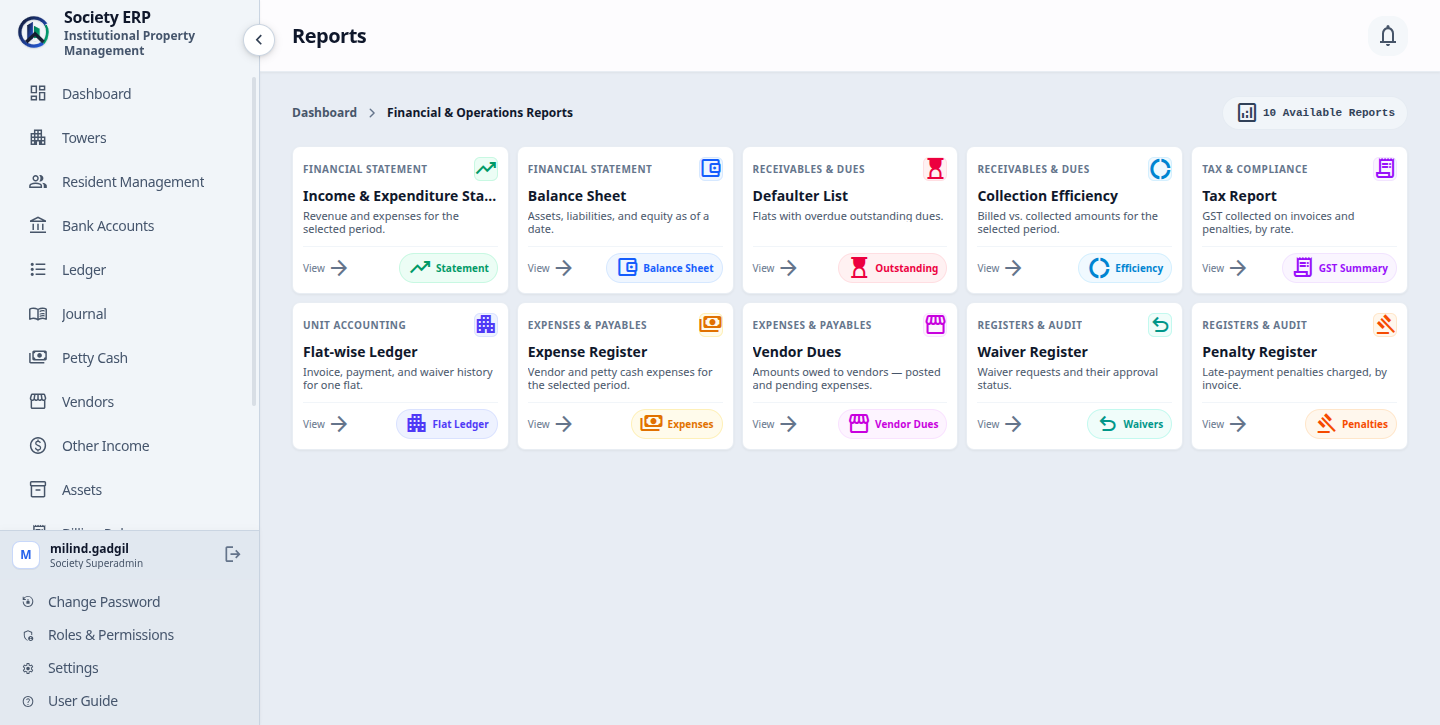
How every report works
All ten reports share the same layout, from top to bottom:
- The filter bar. Date fields, then Apply , then the export buttons.
- Summary figures. A strip of headline totals.
- A chart, on most reports, when there is data to draw.
- The table, with a total row at the bottom.
Back to Reports at the top returns to the cards.
Filters. A report has one of two kinds of date filter:
- A date range (Start date and End date). It opens on the current month: the first of the month to today. Both dates are included.
- An as-of date (As of date), used by the Balance Sheet and the Defaulter List. It opens on today and shows the position at the end of that day.
- Open the report from its card.
- Change the dates.
- Click Apply . The figures, chart and table are recalculated.
Start date after end date
If the start date is later than the end date, the report does not show an error. It quietly goes back to the current month. Check the dates in the filter bar if the figures look unexpected.Exporting. PDF and Excel download the report with the filters currently applied. Click Apply first if you have just changed a date, otherwise the download uses the earlier dates.
- The PDF carries the report name and the society name, the table and the total row. The Income & Expenditure Statement, Balance Sheet and Collection Efficiency PDFs also include a small bar chart headed Overview.
- The Excel file holds the same table and total row. For those same three reports it has an extra sheet named Chart.
- The export contains the table only. The summary strip and the on-screen charts are not copied, and a few column headings are worded slightly differently from the screen.
The Export permission. In a role, each report has two settings: View, which lets the user open the report, and Export, which adds the PDF and Excel buttons. A user with View but not Export can read the report on screen and nothing more. The buttons are hidden for them. As Superadmin you have both.
Reports are always live
Nothing is stored when you open a report. Each time, the figures are calculated from the vouchers, invoices, payments and expenses as they stand at that moment. If a record is corrected later, the same report for the same dates will show the corrected figure.Income & Expenditure Statement
The question: over this period, how much income did the society record, how much expense, and what is left?
Where the figures come from: the journal. The report adds up the lines of every Posted voucher dated within the range, for accounts of type Revenue and Expense. Bills, payments and expenses reach this report only through the vouchers they post.
Filters: Start date and End date.
- Summary: Total Revenue, Total Expenditure and Net Surplus / (Deficit).
- Chart: Revenue vs. Expenditure.
- Revenue table: one row per income account, shown as account code and name with its Amount, ending in Total Revenue.
- Expenditure table: one row per expense account, ending in Total Expenditure.
How to read it: Net Surplus / (Deficit) is Total Revenue minus Total Expenditure. A negative figure, shown in red, means the society spent more than it earned in the period. Only accounts with at least one posted line in the period are listed, so an account you expect but do not see had no activity.
Income is counted when the bill is issued, not when the money arrives. To see money actually received, use Collection Efficiency.
Open Income & Expenditure Statement arrow_forward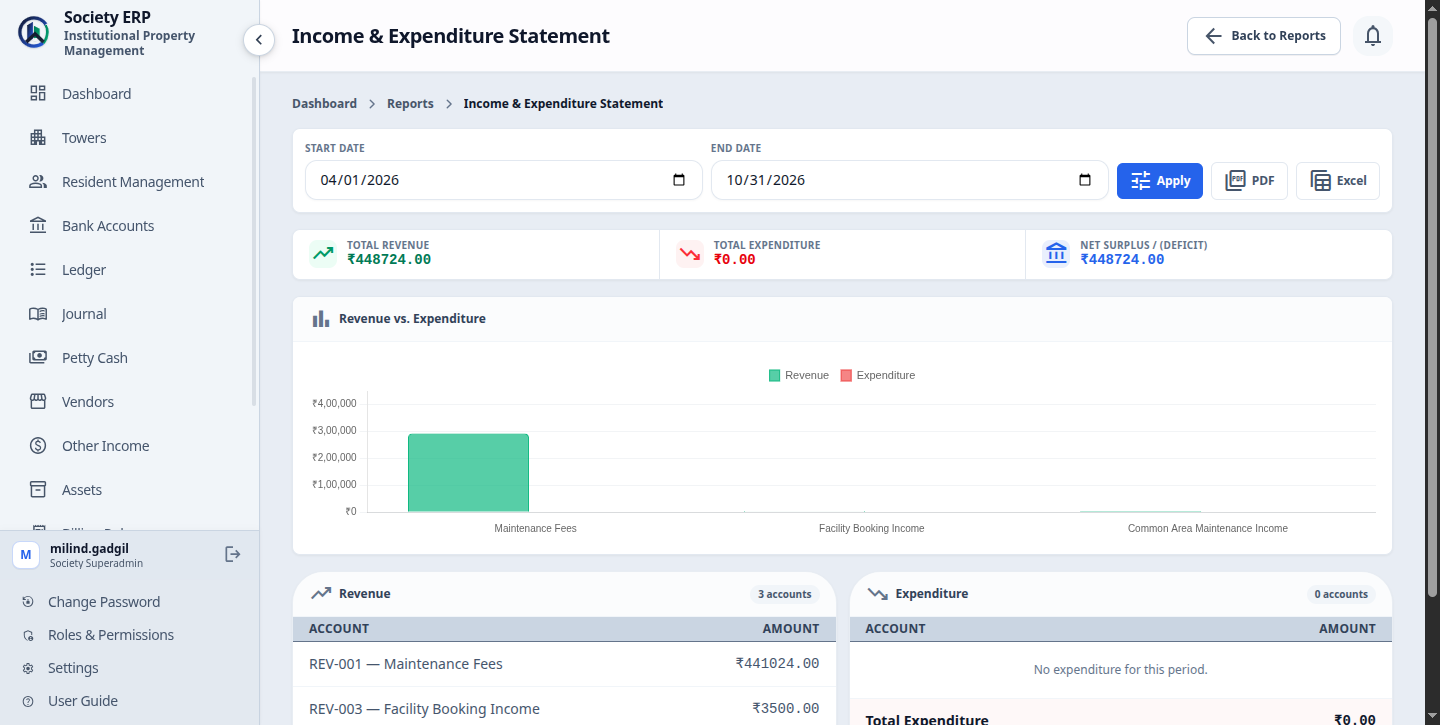
Balance Sheet
The question: on this date, what does the society own, what does it owe, and what is the difference?
Where the figures come from: the journal. Each account's balance is the total of its lines on every Posted voucher dated on or before the as-of date, from the very first voucher onwards.
Filters: As of date.
- Summary: Total Assets, Total Liabilities, Total Equity and Retained Surplus.
- Chart: Financial Position.
- Assets table: one row per asset account, ending in Total Assets.
- Liabilities & Equity table: the liability accounts and Total Liabilities, then the equity accounts, then the line Retained Surplus / (Deficit), ending in Total Liabilities + Equity.
The Retained Surplus / (Deficit) line
This line is not an account in your Ledger, and you will not find it in the chart of accounts. The report calculates it: all income ever posted up to the as-of date, minus all expense ever posted up to that date. It is the society's accumulated result since the books began, and it is counted as part of Total Equity. It is what makes Total Assets equal Total Liabilities + Equity without anyone posting a year-end closing voucher.How to read it: Total Assets and Total Liabilities + Equity should be the same figure. Every voucher has equal debits and credits, so the two sides stay equal as long as each account's type and normal balance are set correctly in the Ledger. A negative Retained Surplus, shown in red, is an accumulated deficit.
Open Balance Sheet arrow_forwardDefaulter List
The question: which bills are past their due date and still not fully paid?
Where the figures come from: invoices. A bill is listed when its status is Issued, Partially Paid or Overdue, its due date is before the as-of date, and it still has an amount outstanding. Draft, Processing, Paid and Cancelled bills are not listed.
Filters: As of date.
- Summary: Defaulter Count and Total Outstanding.
- Chart: Outstanding by Flat (Top 15).
- Columns: Flat, Tower, Owner, Invoice #, Due Date, Overdue (days) and Outstanding, ending in Total Outstanding.
How to read it:
- There is one row per overdue bill, not per flat. A flat with three overdue bills appears three times, and Defaulter Count counts three.
- The longest overdue bills come first. The days badge is yellow up to 30 days, amber from 31 to 90 and red beyond 90.
- The as-of date decides which bills count as overdue and how many days. The Outstanding amount is always today's balance on the bill. Setting an earlier as-of date does not show what was owed back then.
Collection Efficiency
The question: in this period, how much did we collect compared with what we billed?
Measure by chooses how it is worked out. Invoices issued in date range (the default) takes the bills issued in the range and measures what has been collected against those same bills, so older bills cannot inflate it. Journal activity in date range uses ledger postings dated in the range, as the report did before.
The figures below describe the Journal activity view, where invoices and payments are taken separately. In the default view, advance credit counts as collected only when applied to a bill.
- Total Billed: the total of every bill whose billing period starts within the range, cancelled bills excluded. The bill total includes GST and any penalty.
- Total Collected: the total of every successful payment whose payment date is within the range, whichever bill it was for. Payments still processing, or failed, are not counted.
- Collection Efficiency: Total Collected divided by Total Billed, as a percentage. When nothing was billed it shows 0%.
Filters: Start date, End date and Measure by.
On screen: the three summary figures, an Efficiency Gauge, a Billed vs. Collected chart and a Collection Summary table with the same three lines.
How to read it: the percentage is green at 80% or more, amber from 50% and red below that. Because billed and collected are measured independently, the figure can pass 100%: for example when residents clear old arrears in a month with a small billing run. For the same reason a short range can look poor simply because the bills went out at the end of it. A full quarter or year gives a steadier picture.
Open Collection Efficiency arrow_forwardTax Report
The question: how much GST was charged on bills in this period, split by rate?
Where the figures come from: the line items of invoices whose billing period starts within the range, cancelled bills excluded. This report reads the bills directly and does not read the journal.
Filters: Start date and End date.
- Summary: GST on Charges, GST on Penalties and Total GST.
- Chart: GST by Rate.
- GST Breakdown table: one row per GST rate (for example 18% GST) with its Amount, then a Penalties GST row, ending in Total GST.
How to read it: each fee type on a bill can carry its own GST rate, so one bill may contribute to more than one row. Lines with no GST do not appear. GST on Penalties applies only where the billing rule charges GST on its late-payment penalty. It is worked out today from each bill's penalty rules and due date, so it can change from one day to the next.
The report shows GST charged on bills. It does not show whether the resident has paid, and it does not include GST on vendor bills.
Open Tax Report arrow_forwardFlat-wise Ledger
The question: for one flat, what was billed, what was paid or waived, and what is the balance?
Where the figures come from: that flat's invoices (cancelled ones excluded), the successful payments against them, their approved waivers and their penalties.
Filters: Tower, Floor, Flat, Start date and End date.
- Choose a Tower. The Floor list narrows to that tower.
- Choose a Floor, then a Flat.
- Leave both dates empty to see the flat's whole history, or enter dates to limit it.
- Click Apply .
Until a flat is chosen the page shows "Select a tower, floor and flat above to view its ledger." Choose a flat and click Apply before using PDF or Excel.
- Summary: Flat, Total Invoiced, Penalties, Total Paid and Closing Balance.
- Chart: Balance Trend.
- Ledger Entries columns: Date, Description, Status, Charge, Penalty, Payment, Waiver and Balance.
Each row is one of four kinds:
| Invoice | Dated the start of the billing period. Shows the invoice number, its due date and its status. Charge is the bill amount with GST, before any penalty. |
| Penalty | Dated the bill's due date. The late-payment penalty on that bill. |
| Payment | Dated the payment date, with the payment mode. Successful payments only. |
| Waiver | Dated the day it was approved, with the start of its reason. Approved waivers only. |
How to read it: Balance is a running total. Charges and penalties add to it, payments and waivers reduce it. The last line, Closing Balance, is what the flat owes. It is red when money is owed and green when it is zero or the flat is in credit.
- The date range selects bills by the start of their billing period. Every payment, waiver and penalty belonging to a selected bill is shown, even when its own date falls outside the range.
- With a Start date, the table begins with an Opening Balance row: the unpaid amount on all earlier bills. With no Start date there is no opening row, because the ledger starts from the flat's first bill.
What residents see: My Ledger
Owners and tenants have My Ledger in their sidebar. It is this same report, fixed to their own flat. They get the two date fields but no Tower, Floor or Flat choice, and they cannot open any other flat. Residents can always download their ledger as PDF or Excel. If the Flat-wise Ledger is switched off for the society, residents lose My Ledger as well.Expense Register
The question: what expenses were entered in this period, from vendors and from petty cash, and what is their status?
Where the figures come from: vendor expenses and petty cash expenses whose expense date is within the range. This report reads the expense records directly and does not read the journal.
Filters: Start date and End date.
- Summary: Total Expense and Entries.
- Chart: Expenses by Category.
- Columns: Date, Source (Vendor or Petty Cash), Category, Description, Status and Amount, ending in Total.
How to read it: rows are in date order. For a vendor expense, Category is the vendor's category and the description starts with the vendor's name. Petty cash rows have no category.
What the total counts
The register lists expenses that are Pending Approval, Posted and Rejected, so you can see everything that was entered. Total Expense adds only the Posted ones, the money actually spent. Use the Status column to tell the rows apart.Vendor Dues
The question: for each vendor, how much expense is waiting for approval, and how much has been posted, in this period?
What 'dues' means here
In this report, "dues" means vendor expenses that are still Pending Approval. It does not mean unpaid bills. The system does not track whether a vendor has actually been paid: when a vendor expense is approved it is posted to the books against the bank ledger in one step. So this report cannot tell you which vendor invoices remain unpaid. It tells you which expenses someone has entered and nobody has approved yet.Where the figures come from: vendor expenses whose expense date is within the range, grouped by vendor.
Filters: Start date and End date.
- Summary: Total Pending (Dues), Total Posted and Vendors.
- Chart: Pending vs Posted by Vendor.
- Columns: Vendor, Pending (Dues), Posted and Total, ending in a Total row. The PDF and Excel files have the Vendor, Pending (Dues) and Posted columns only.
How to read it:
- Pending (Dues) is the total of the vendor's expenses awaiting approval. A dash means none. An amount here is work for an approver.
- Posted is the total of the vendor's approved expenses in the period, shown beside the pending amount for comparison.
- Rejected expenses are in neither column. A vendor whose only expenses in the period were rejected still appears, with nothing in either column.
- Vendors are listed in name order. A vendor with no expenses in the period is not listed.
Waiver Register
The question: which waivers were requested in this period, what happened to each, and who decided?
Where the figures come from: waiver requests, selected by the date the request was raised, not the date it was decided.
Filters: Start date and End date.
- Summary: Total Requests and Total Approved.
- Columns: Flat, Invoice #, Status (Pending Approval, Approved or Rejected), Decided By and Amount, ending in Total Approved.
How to read it: every request is listed, whatever its status, but Total Approved adds only the approved ones. Pending and rejected amounts are shown in their rows and left out of the total. Decided By is the username of the person who approved or rejected the request, and is blank while it is pending. This report has no chart, and it does not show the reason. Open the waiver itself to read that.
Open Waiver Register arrow_forwardPenalty Register
The question: which bills carry a late-payment penalty, on which charge, and how much?
Where the figures come from: invoices that have a penalty recorded and whose billing period starts within the range. The date range is about the bill's period, not the day the penalty was applied.
Filters: Start date and End date.
- Summary: Total Penalties and Records.
- Chart: Penalties by Flat (Top 15).
- Columns: Flat, Invoice #, Fee Type, Calc Type, Overdue (days) and Penalty, ending in Total.
How to read it:
- There is one row per penalised charge on a bill, not per bill. A bill with two fee types that both carry a penalty rule gives two rows.
- Calc Type is the method set on the billing rule: FLAT_AMOUNT, SIMPLE_INTEREST or COMPOUND_INTEREST.
- Penalty includes GST on the penalty where the billing rule charges it.
- The days overdue and the penalty amount on each row are worked out as of today from the bill's due date and its penalty rule. For a bill that is still unpaid and has a recurring penalty, the figure grows over time, so the same range can show a larger total next month.
Common problems
- A report is missing from the Reports page. There are two possible causes. The first is permissions: your role does not have View on that report. The second is that the report, or a feature it reads from, is switched off for the society by the Platform Admin. A report is removed when any of its sources is off, and it then disappears for everyone, the Superadmin included. The table below shows what each report needs.
- The PDF and Excel buttons are missing. The user's role has View on the report but not Export. Turn Export on for that report in the role.
- The Income & Expenditure Statement or Balance Sheet does not match what you expect. Only Posted vouchers count. A voucher that is still a Draft, or was Cancelled, is ignored. A reversed voucher and its reversal are both posted, so they cancel each other out. Check the Journal for drafts dated in the period.
- An account is missing from a financial statement. Accounts with no posted lines in the period (or, on the Balance Sheet, up to the as-of date) are left out.
- The Balance Sheet's two sides differ. Look for an account whose type or normal balance is set wrongly in the Ledger. An account's type decides which side of the sheet it falls on.
- The Expense Register total differs from expenditure on the Income & Expenditure Statement. The register totals posted vendor and petty cash expenses only. The statement also includes expenses that did not come from vendors or petty cash, such as asset services and journal vouchers written by hand.
- Collection Efficiency is above 100%, or very low. In the Journal activity view, billed is counted by the start of the billing period and collected by payment date, so the two do not always fall in the same range. Use a longer range, or switch Measure by to Invoices issued in date range, which measures collection against the same bills.
- A bill is missing from Collection Efficiency, the Tax Report, the Flat-wise Ledger or the Penalty Register. These select bills by the start of the billing period, not by the date the bill was generated or its due date. Widen the range to cover the period start.
- The report shows the current month although you chose other dates. The start date was after the end date, so the report fell back to its default range.
- A resident's payment is not in their ledger. Only successful payments are shown. A cheque or bank transfer that is still processing appears once it clears.
- Flat-wise Ledger PDF or Excel does not download. No flat is selected. Choose the tower, floor and flat, click Apply, then export.
| Report | Needs these features switched on |
|---|---|
| Income & Expenditure Statement | Ledger and Journal Entries |
| Balance Sheet | Ledger and Journal Entries |
| Defaulter List | Invoices |
| Collection Efficiency | Invoices |
| Tax Report | Invoices |
| Flat-wise Ledger | Invoices |
| Expense Register | Vendors and Petty Cash (both) |
| Vendor Dues | Vendors |
| Waiver Register | Invoices and Waivers |
| Penalty Register | Invoices |